
Shotgun metagenomics reveals alteration of gut microbiota and metabolic pathways in adults with poor sleep quality
S.-Y. Kim1, D. Ho1, W.-J. Lim1
1Ewha Womans University College of Medicine, Psychiatry, Seoul, Korea, Republic of
Background: Emerging evidence suggests that the gut microbiome plays a role in sleep disturbance.
Aims & Objectives: This study explored the characteristics of the gut microbiome and the functional metabolic pathways related to sleep quality.
Method: A total of 588 participants were recruited. Sleep quality was assessed using the Pittsburgh Sleep Quality Index, employing a cutoff score of 8.5. Based on this criterion, 42 individuals with poor sleep quality (PSQ) and 546 healthy controls with good sleep quality (GSQ) were identified. The fecal microbiome was analyzed using shotgun whole-metagenome sequencing, and groups were compared based on diversity metrics, differentially abundant species, metabolic pathways and metabolites.
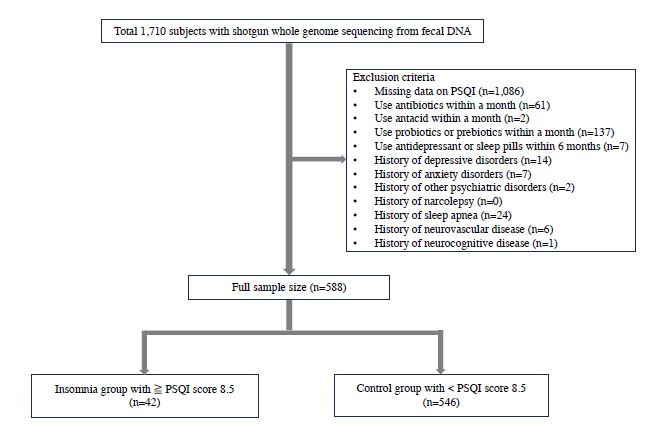
Results: No significant differences in alpha and beta diversity indices were observed between individuals experiencing subjective sleep disturbances and those who did not. Klebsiella pneumoniae was more abundant in the PSQ group (b = 0.476; q = 0.017). Additionally, the following metabolic pathways were enriched in the PSQ group: octane oxidation (coefficient = 0.495, q = 0.033), the superpathway of acetyl-CoA biosynthesis (coefficient = 0.377, q = 0.025), superpathway of (Kdo)2-lipid A biosynthesis (coefficient = 0.367, q = 0.026), petroselinate biosynthesis (coefficient = 0.353, q = 0.034), and superpathway of histidine, purine, and pyrimidine biosynthesis (coefficient = 0.349, q = 0.042). When metabolites levels associated with poor sleep quality were inferred using MelonnPan, higher xanthine levels were observed in the PSQ group (coefficient = 0.018; q = 0.025).
Table 1. Demographic characteristics of study participants
BMI: Body Mass Index; PSQI: the Pittsburgh Sleep Quality Index
Table 1. Demographic characteristics of study participants
| Variables Total sample number (N = 588) | Poor sleep quality group PSQI ≥ 8.5 (n=42) | Good sleep quality group PSQI < 8.5 (n=546) | p-value |
| Age (years) | 44.32±9.18 | 44.02±7.53 | 0.803 |
| Female (%) | 20 (47.62) | 170 (31.14) | 0.028 |
| BMI (Kg/m2) | 22.99±2.90 | 23.81±3.13 | 0.098 |
| Participants with nutrient information (N of remaining data = 439) | n of remaining data = 32 | n of remaining data = 407 | |
| Total energy (kcal/d) | 1431.93±661.19 | 1431.90±613.31 | 1.000 |
| Carbohydrate (g/d) | 232.85±100.87 | 242.04±105.07 | 0.633 |
| Fat (g/d) | 31.78±24.05 | 28.19±18.55 | 0.415 |
| Protein (g/d) | 50.21±28.00 | 48.53±24.08 | 0.708 |
| Total fiber (g/d) | 3.34±1.78 | 3.59±2.06 | 0.513 |
Discussion & Conclusions: In summary, this study poses significant questions regarding the relationship between the gut microbiome and poor sleep quality.
In sessions