
PPARγ as a predictive biomarker for antidepressant response in major depressive disorder: insights from TNIP1 transcriptional regulation
Y.-W. Lin1, Y.-Y. Hung2
1Kaohsiung Chang Gung Memorial Hospital, Department of Psychiatry, Kaohsiung City, Taiwan, 2Kaohsiung Municipal Fong Shan Hospital - Under the Management of Chang Gung Medical Foundation, Department of Psychiatry, Kaohsiung City, Taiwan
Background: Major depressive disorder (MDD) is a debilitating disease possibly linked to immune defense mechanisms. TNIP1, a key anti-inflammatory regulator in NF-κB and TLR pathways, is implicated in MDD, but its transcriptional regulation and role in treatment response are unclear.
Aims & Objectives: Elucidating the transcriptional regulation of TNIP1 in depression.
Method: We analyzed mRNA expression of TNIP1 and 13 transcription factors in monocytes from pre- and post-treatment (4-6 weeks) MDD patients and healthy controls. Peripheral blood mononuclear cells were isolated, tagged by CD14, and mRNA was extracted and analyzed. Participants were recruited at Kaohsiung Chang Gung Memorial Hospital (2014–2025). ANCOVA, paired t-tests, and multiple linear regression adjusted for age, gender, BMI, and smoking were used to compare groups and predict treatment outcomes.
Results: This study encompassed 62 MDD patients and 52 healthy controls, mean age was 43.24 ± 10.76 years, with males accounting for 23.3%. Pre-treatment HAMD-17 averaged 23.90 ± 4.60, and post-treatment HAMD-17 averaged 8.43 ± 4.24 (Table 1). Compared to controls, MDD patients had significantly higher PPARγ (F = 6.213, p < 0.001), higher FOS (F = 2.775, p = 0.023) and lower JUN (F = 2.631, p = 0.029) expression. After treatment, TNIP1 significantly increased (p = 0.031), without transcription factors changed (Figure 1A). Lower pre-treatment PPARγ was associated with greater depressive symptom improvement (p = 0.016) (Figure 1B-C).
Table 1. Demographic and clinical data on healthy controls and MDD patients
Sex and smoking, Chi-square test; age and BMI, Student’s t-test
Figure 1A. mRNA expression level of TNIP1 transcription factors in monocytes of health control, pre-treatment and post-treatment group. 1B. Linear regression of PPARγ level to difference of pre-treatment between post-treatment HAMD. 1C. ROC analysis of mRNA expression level of PPARγ to stratify responder to non-responder.
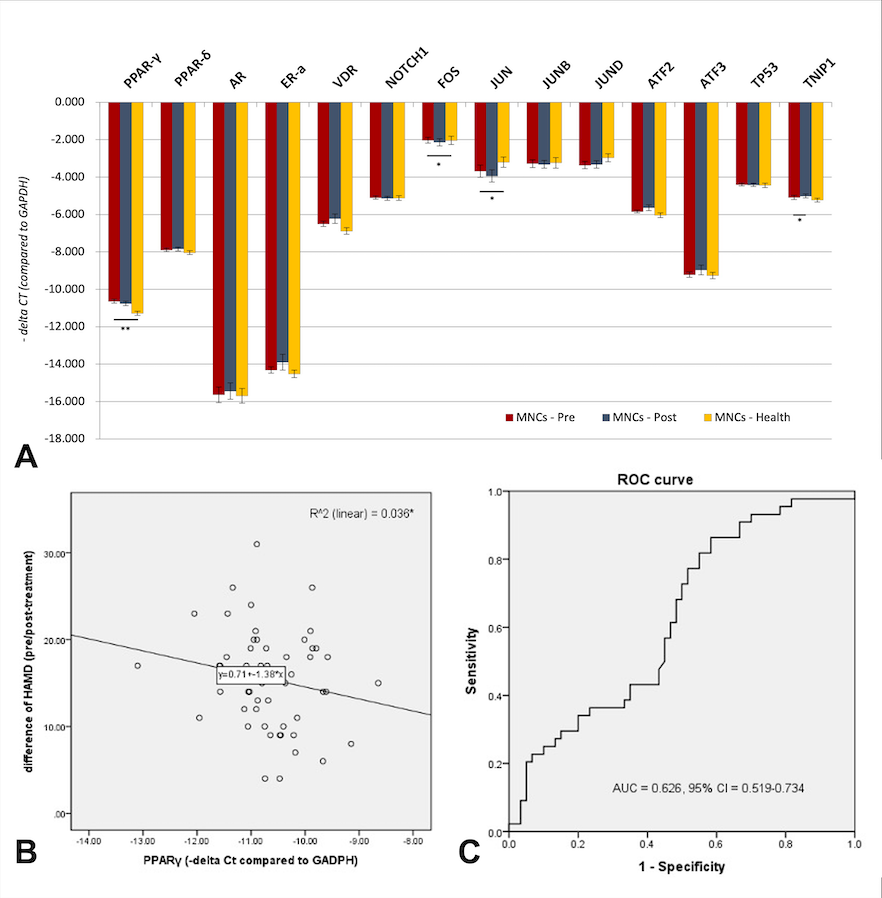
Table 1. Demographic and clinical data on healthy controls and MDD patients
| MDD (n=62) | Health control (n=52) | p-value | |
| Age (years) | 46.14 ± 10.35 | 39.44 ± 10.34 | 0.001* |
| Gender (M/F) | 16/46 | 10/42 | 0.405 |
| BMI (kg/m2) | 24.82 ± 4.45 | 23.04 ± 3.64 | 0.023* |
| Smoking (yes/no) | 29/33 | 3/49 | <0.001** |
| Pre-treatment HAMD-17 | 23.90 ± 4.60 | ||
| Post-treatment HAMD-17 | 8.43 ± 4.24 | ||
| Responsder | 43/62 | ||
| Non-responder Incomplete data | 7/62 12/62 |
Sex and smoking, Chi-square test; age and BMI, Student’s t-test
Figure 1A. mRNA expression level of TNIP1 transcription factors in monocytes of health control, pre-treatment and post-treatment group. 1B. Linear regression of PPARγ level to difference of pre-treatment between post-treatment HAMD. 1C. ROC analysis of mRNA expression level of PPARγ to stratify responder to non-responder.
Discussion & Conclusions: This study highlights the differential expression of PPAR-γ, FOS, and JUN in MDD patients, underscoring their potential roles in immune regulation. The association between lower pre-treatment PPAR-γ expression and improved treatment outcomes suggests its utility as a biomarker for predicting therapeutic response.
In sessions